Analyze Memory
EmbedOps includes a memory analysis tool that lets you generate a Treemap diagram from an ELF binary. This gives you a high level overview of what is consuming memory in your particular project.
Prerequisites
- Created an EmbedOps project that is registered on the EmbedOps platform
- Project outputs a
.elffile
Steps
- Make sure the project has been built, either via
eo buildor by running the build command directly in the Dev Container
Under the hood
What's the eo build doing? It's running the individual steps from the pipeline locally inside the dev container. You can see which commands it's running yourself by opening the ci/pipeline.json file. E.g. for the quickstart project, you should see this:
    {
        "steps": [
            "echo 'Starting pipeline...'",
            "ci/arm-none-gcc-build.sh",
            "ci/cppcheck.sh"
        ]
    }
-
Run the memory analysis tool:
This command will give a list of ELF files to choose from. Select one by pressing enter in the prompt. -
After analysis completes, the CLI attempts to open a browser window to display the resulting diagram. It also prints the URL for your convenience. This diagram is rendered using the EmbedOps platform and may look like this:
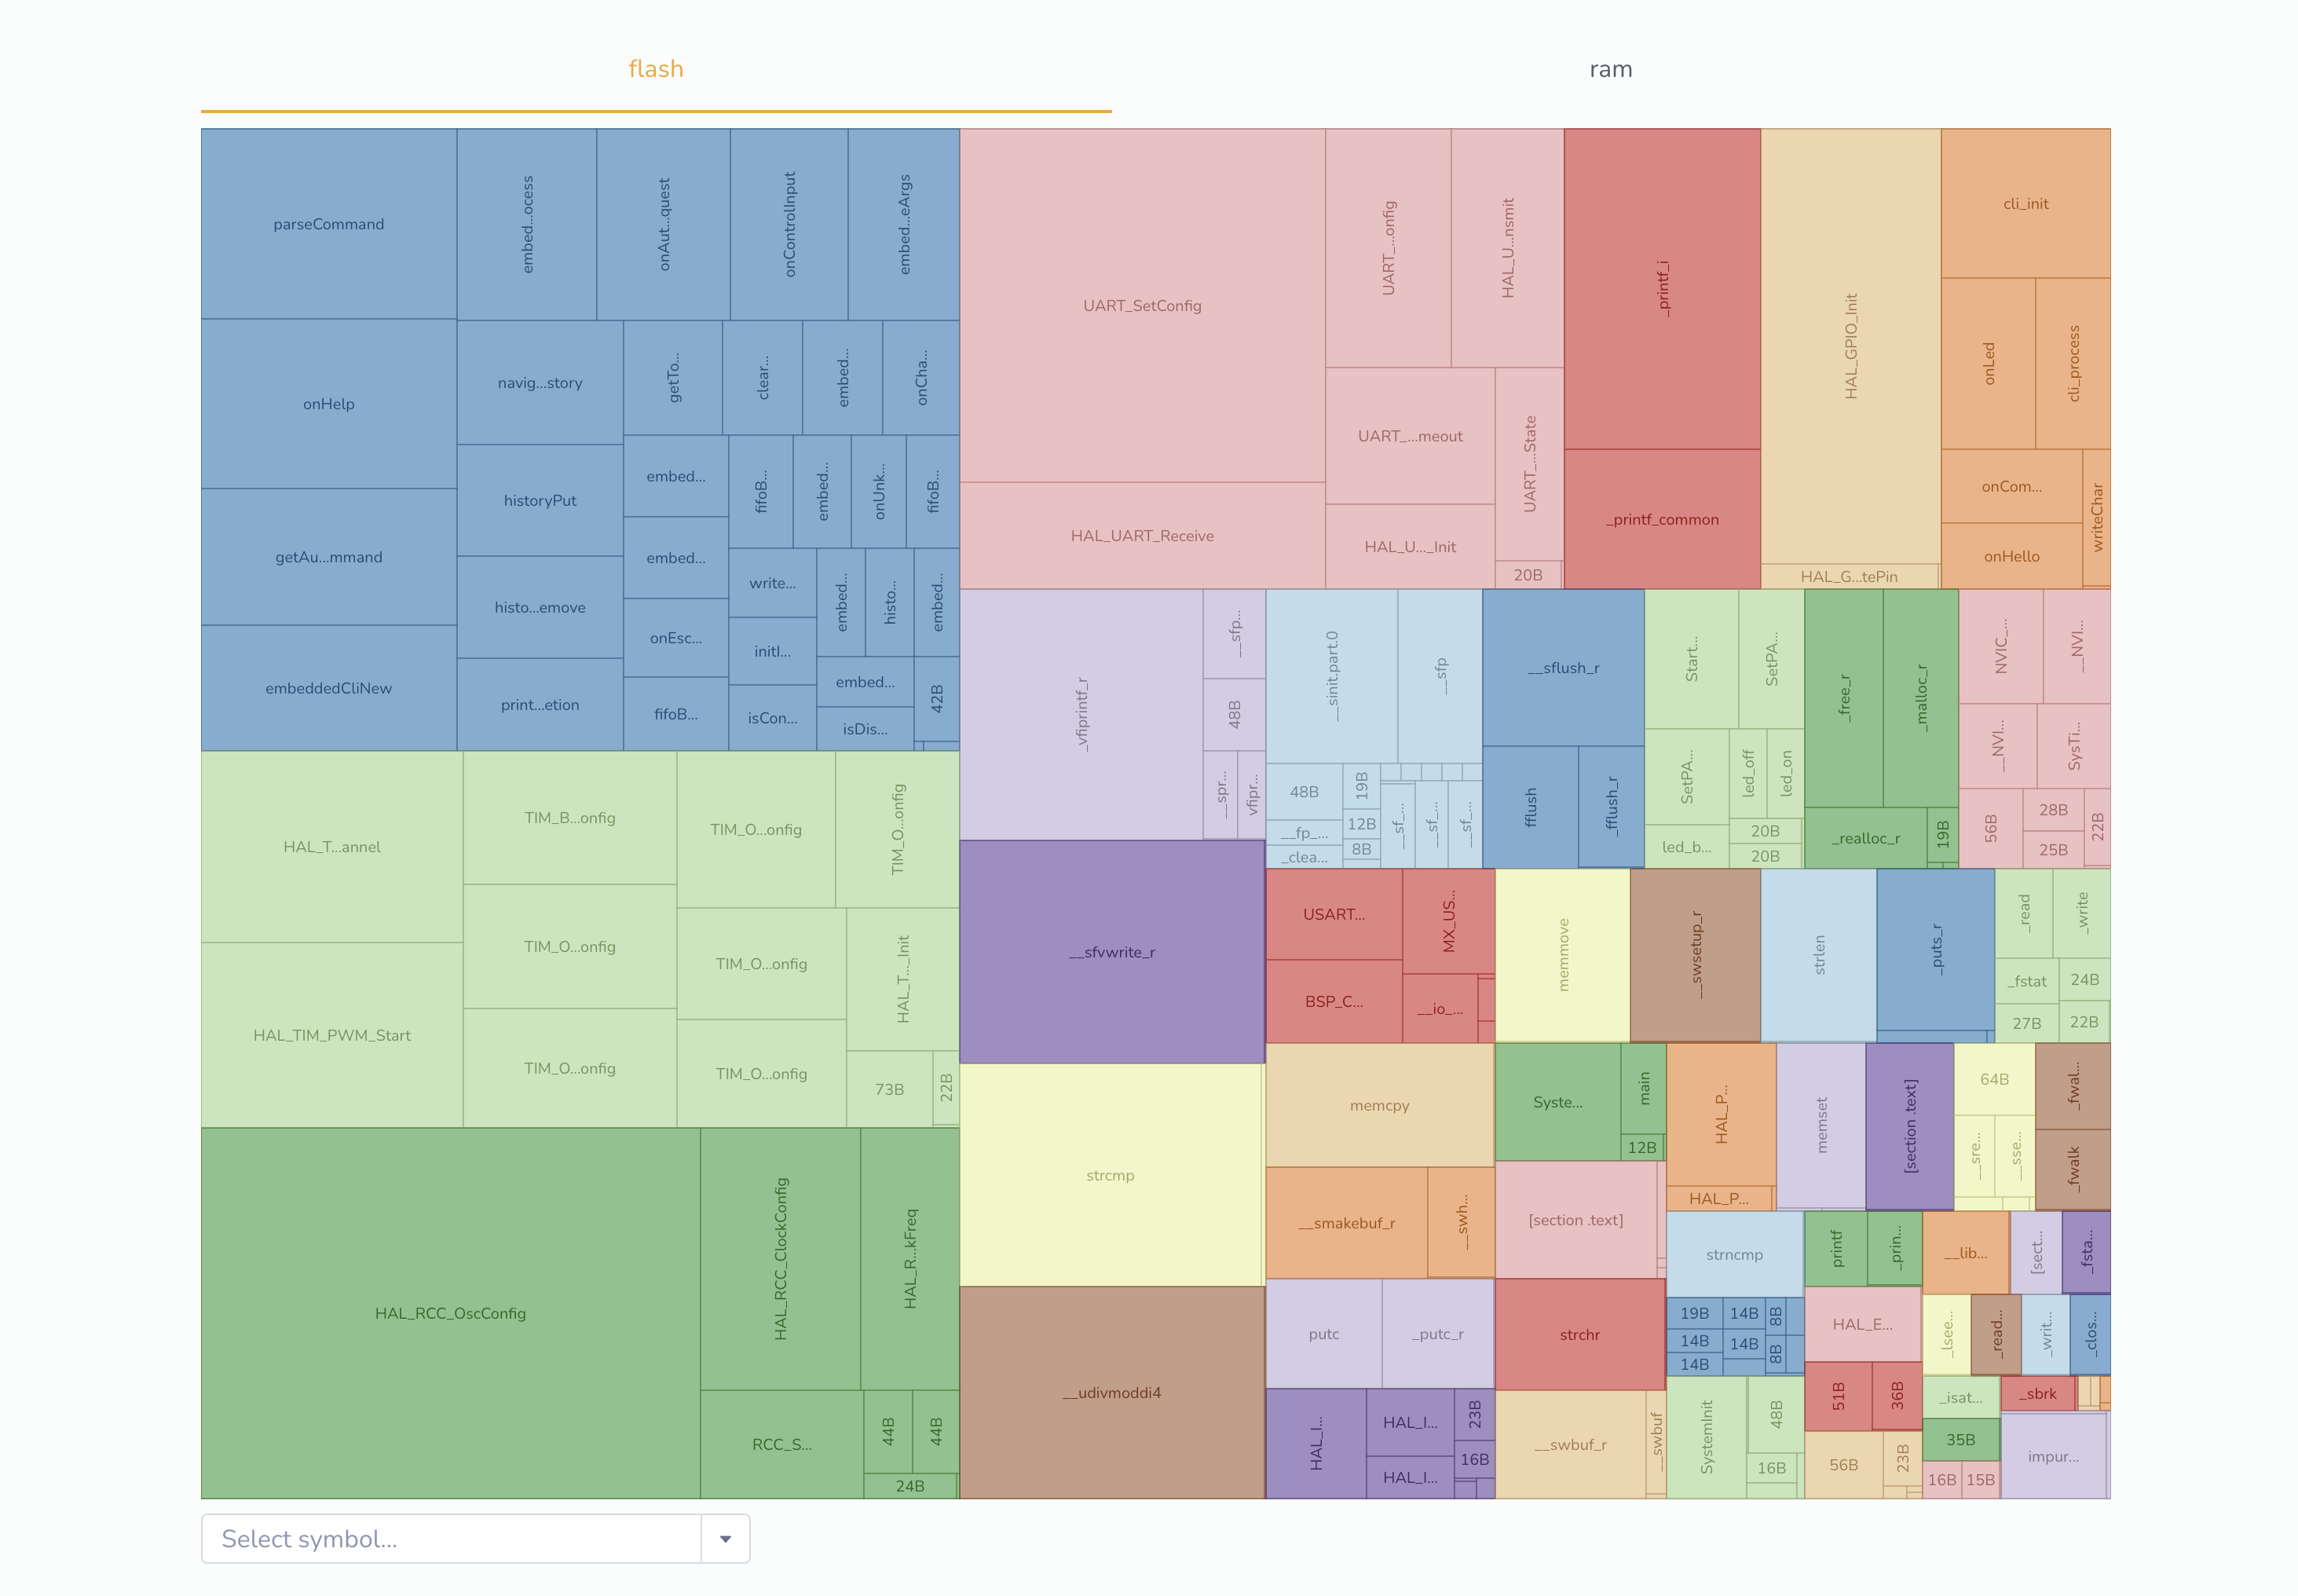
Hover over parts of the diagram on the EmbedOps platform to see how large a particular section of flash or ram is.
Analyze Memory vs. Report MemUsage
If you've been exploring documentation, you may have noticed that the Generate Reports how-to also mentions calculating memory usage. This is a different tool! The memusage report sends basic size information up to the EmbedOps platform to track overall memory usage over time. The analyze memory functionality provides a more in-depth view, and is a one-off calculation based on your current build.